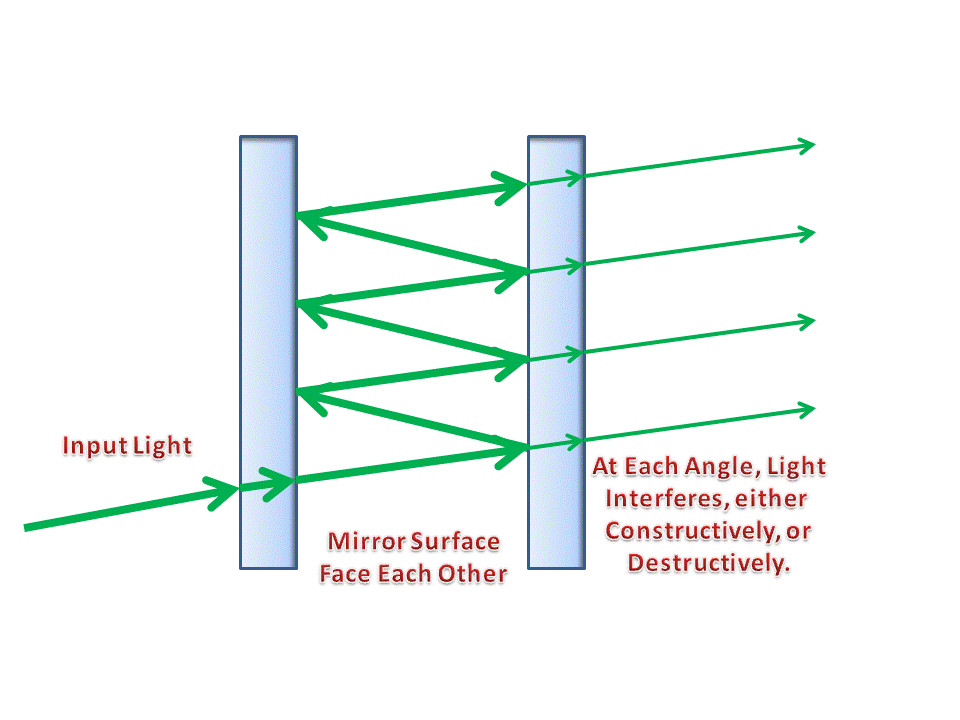
This page describes the operating principle of the Fabry Perot interferometer or spectrometer. Determining the longitudinal modes or frequency content of a laser cavity, or the frequency spectrum of a light source can be accomplished using this versatile and sensitive instrument.
Fabry Perot Interferometer
A Fabry-Perot interferometer basically consists of a set of parallel mirrors such that light can enter through the back side of one mirror and be reflected between the two mirror surfaces many times before finally exiting through the other mirror. Interference between the reflected beams will allow only certain angles to be transmitted (constructive interference) while angles between the constructively interfering exit angles are supressed in amplitude (dark).

Finesse of a Fabry-Perot Interferometer
The coefficient of finesse of a Fabry Perot interferometer is a function of the reflectivity of the mirrors used.
Finesse is the ratio of the separation of adjacent fringe maxima to their individual width at half maiximum.
Ratio of separation of adjacent maxima to the halfwidth of individual fringes. Tells how narrow the fringes should look compared to the distance between them. Higher finesse shows more narrow fringes compared to fringe separation.
Free Spectral Range of a Fabry Perot Interferometer.
Free spectral range depends on the wavelength and the distance between the mirrors, t.
This is the change in λ needed to shift by the distance between consecutive orders of the main wavelength, so changes less than this should be seen in between consecutive orders. Smaller t will fit greater changes in λ between consecutive orders, while greater t will give better separation between very small changes in λ .
Greater t (distance between mirrors) will better separate very close spectral lines contained in a multimode laser beam for example.
Frequency mode for free spectral range.
At this wavelength (1047nm) a 10GHz interferometer will show good separation for a change of 0.018nm
At the green wavelength, 532nm for example (5.6X10^5GHz), a half meter t will fit a change of 300MHz between consecutive orders of fringes giving a good separation between frequencies that differ by only a few to a few hundred MHz, while a 3mm separation will show fringes for larger differences from the main frequency, but they will not be as well separated.
To get good separation for a change of 5MHz at 1047nm I'd need a 60m Fabry Perot interferometer.
In frequency space, greater t (separation between mirrors) shows a smaller free spectral range (smaller differences in frequency span the separation between consecutive order fringes).
Angular Separation Between the Orders of Fringes
The output from a simple Fabry Perot interferometer can be focused onto an image plane by a simple lens (or beautiful, well corrected telescope, if you wish) and if the input source consists of a single frequency, or fairly well separated discrete frequencies, then the image plane will show a series of rings. The irradiance of each ring will depend on the amount of light in the input beam that is at the angle represented by that ring. So, if you want to light up outer rings, you can use a diverging lens to put more light into the larger angles. Try it! It is fun to manipulate the lighting until you get a feel for what you're doing.
Quick Science & Math References
- Our Solar System.
- Earth Facts.
- The Metric System.
- Trigonometric Identities.
- Vector & Tensor Identities.
- Explicit Forms of Vector Operators
- Light & Electromagnetic Spectrum.
- Common Laser Wavelengths.
- Human Physiology Facts.
- Human History Timeline
- Geologic Timeline
- Cambrian Explosion
- Life on Earth Timeline
- ASCII Codes and HTML Display Codes
- Thousands of HTML Symbol Codes
- HTML Symbol Codes for Greek Letters
- The Best Way to put Equations on your Web Page
Physics Basics Series
- Basics of Classical Mechanics.
- Basics of Quantum Mechanics.
- Basics of Electrodynamics.
- Basics of Optics.
- Basics of Mathematical Tools for Physics.
- Basics of Plasma Physics.
- Basics of Solid State Physics.
Math Basics Series
- Numbers
- Arithmetic
- Algebra
- Geometry
- Analysis
Technology Basics Series
- Basics of Remote Sensing.
- Basics of Digital Signal Processing.
- Critical Electronic Circuits
- Infrared Imaging Basics
Knowledge Branches
- Information Theory
- How Reading Works in the Brain
- Psychology of Learning
- Logic
WORK IN PROGRESS
- What is the Stark Effect?
- The Chemistry of Love &/or Addiction
- Critical Thinking: How to question what you see, read or hear.
- Aristotle's Prior Analytics - the birth of Logic.
- Optical Solutions, lenses that solve problems
- Fractals
- PTC - Photon Transfer Curve or Mean Variance Analysis
- 3-D Noise
- Laser Primer
- Rail Guns
- Special Relativity
- Radar Technology
- Acousto-optic Cells
- Harmonic Generation for Laser Frequency Doubling (SHG) and Tripling -using non-linear crystals.
- Measurement: Accuracy & Precision.
- Things you should know about computer modeling of physical phenomena!
- Giant Magneto-resistance
- Peltier Cooling
- Pyro-Electric Detectors
- Piezo-Electric Crystals
- Laser Speckle
- FFT and DFT the fast fourier transform and the discrete fourier transform
- Fabry Perot Etalon
- The Hydrogen Atom.
- PCA (Principal Component Analysis)
- Energy per mass in fuels such as Hydrogen, Gasoline, Kerosene, HMX etc...
- Nobel prize winning work on the CCD
- How does a CCD work and what are the normal characteristics of a CCD
- Nobel Prize Winning work on Giant Magneto-resistance
- FROG -frequency resolved optical gating
- Optical Wavefront Sensing
- THz imaging and time-domain spectroscopy
- Camera Calibration
- Laser Designators
- Resampling
