Physics Basics Series
- Basics of Classical Mechanics.
- Basics of Quantum Mechanics.
- Basics of Electrodynamics.
- Basics of Optics.
- Basics of Mathematical Tools for Physics.
- Basics of Plasma Physics.
- Basics of Solid State Physics.
Troy Stark's Science & Society Opinion Blog

The Mandelbrot Set
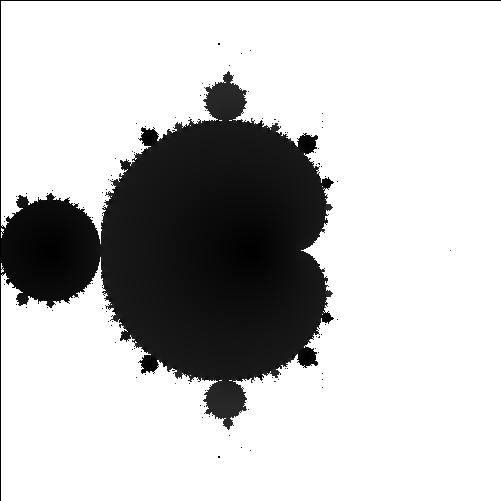
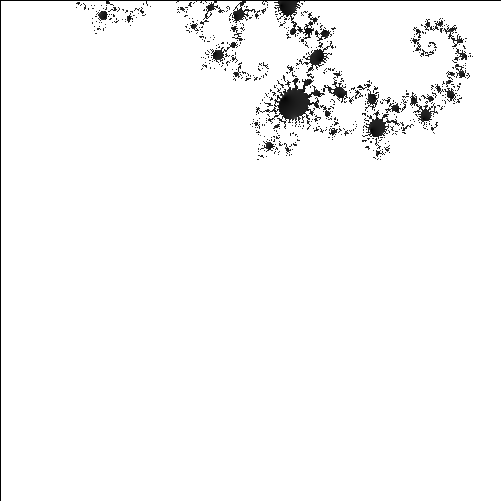
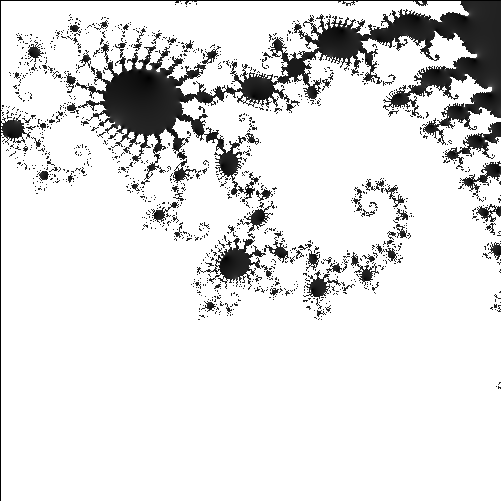
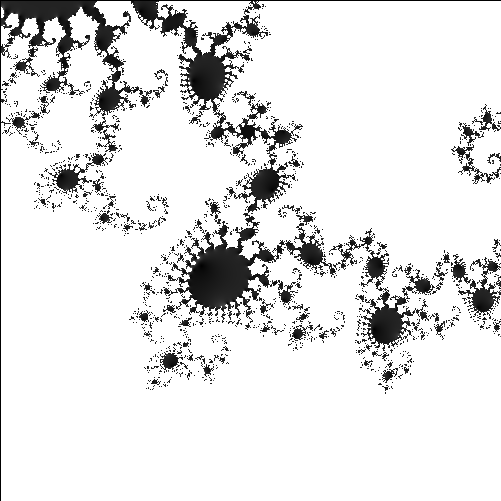
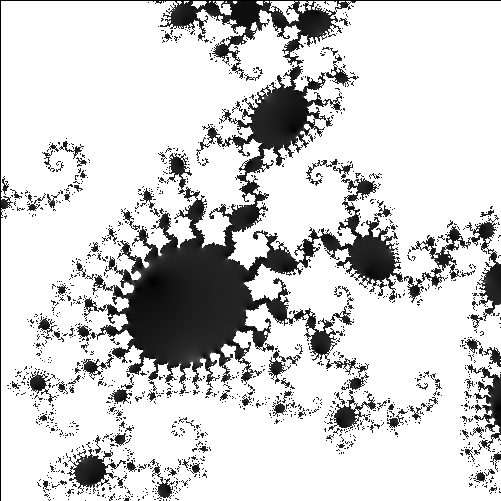
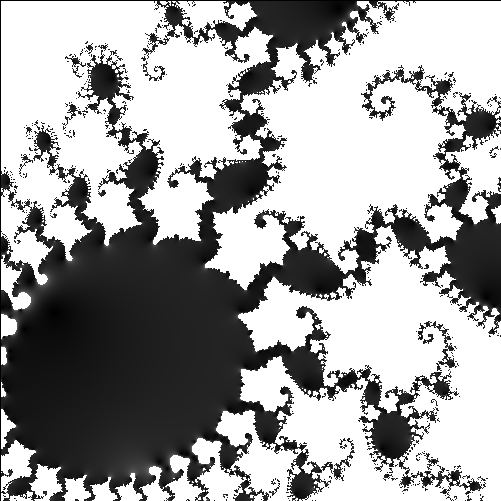
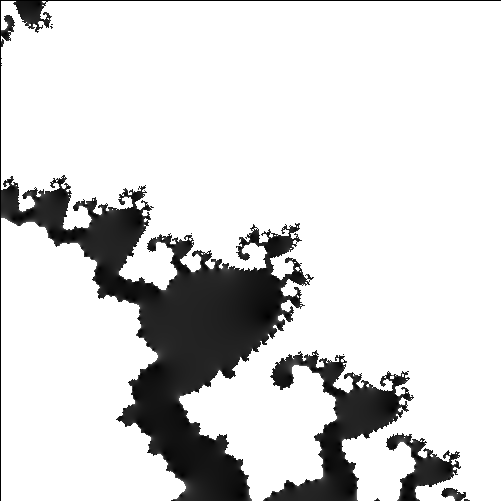
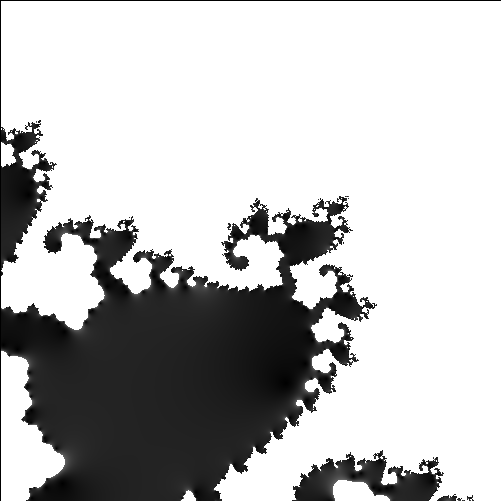
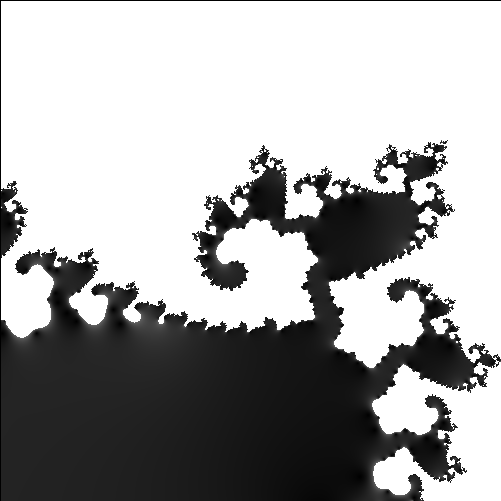
I'm sure you've seen images of the Mandelbrot set, that wonderfully intricate little fractal. All that beauty, an infinitely detailed interface between what is in the set and what is excluded, is created by a very simple little algorithm.
Definition
The Mandelbrot set can be defined as the set of points,  , in the complex plain for which the infinite series
  , converges to a finite value.

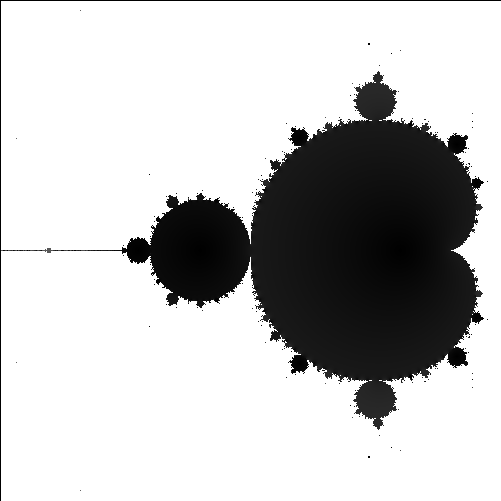
The entire set is contained within a radius of 2 in the complex plane.
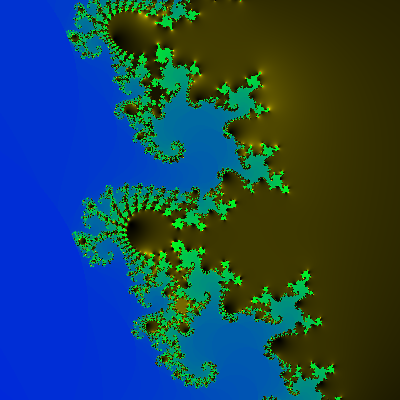
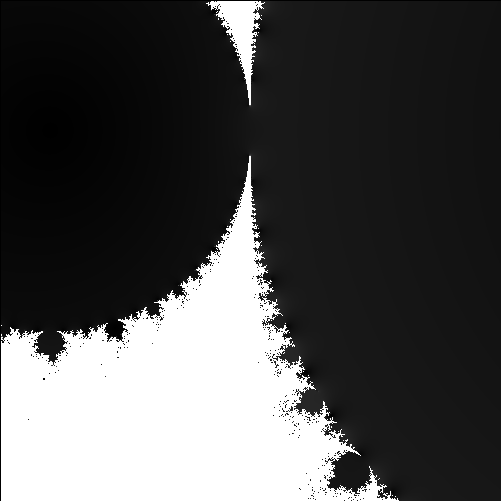
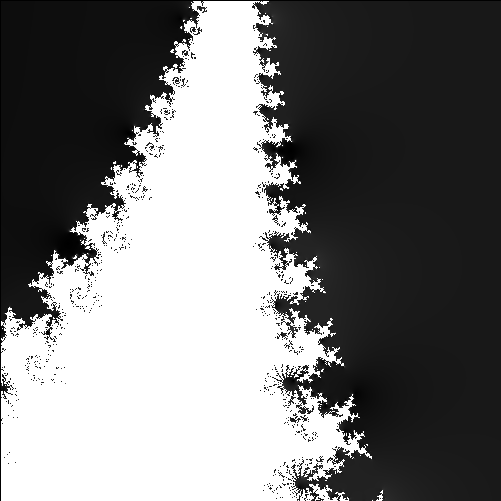
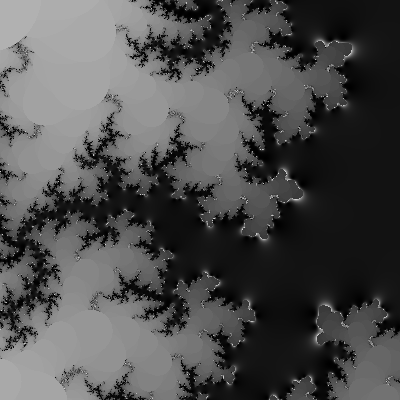
In the images shown, the real axis is the horizontal (x) axis and the imaginary axis is the vertical (y) axis. There is no reason to go farther from the origin than -2 or 2 on the real axis or -2i or 2i on the imaginary axis, since any point that far from the origin will quickly diverge for the series shown above. The dark pixels represent starting points, , in the complex plane that did not diverge. My test for convergence is whether or not for each starting point, , the series, , reached an absolute value of 2 or greater after 100 iterations of the series shown above. You can also get beautiful pictures by shading differently or coloring differently depending on how long it took to diverge, or by the absolute value reached by a certain number of iterations or both.

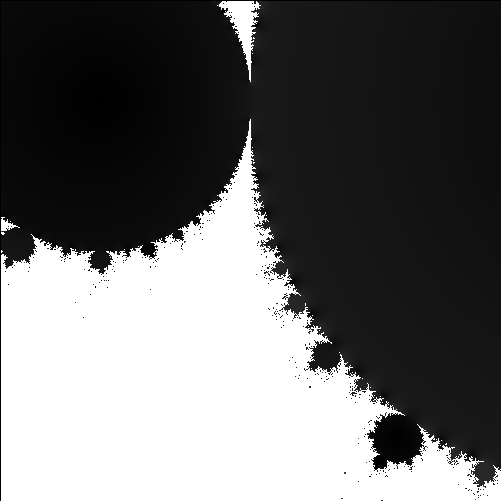
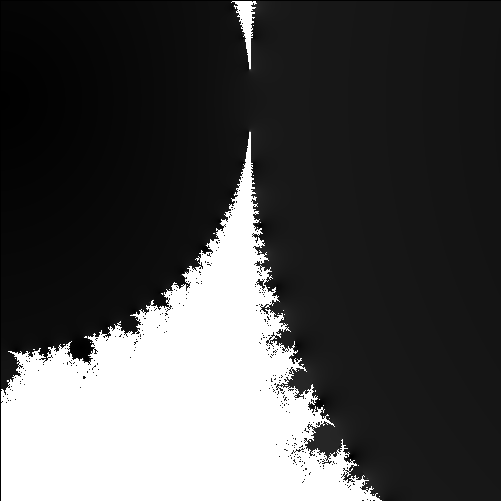
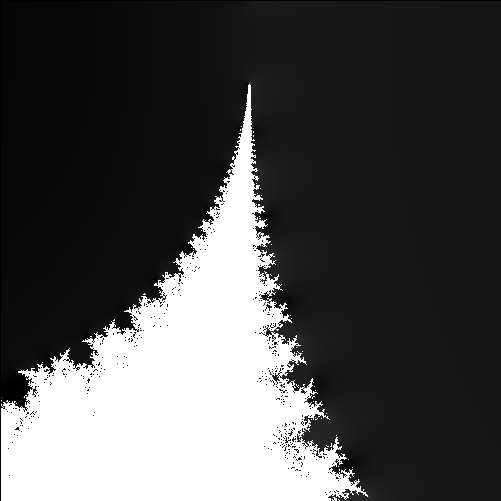
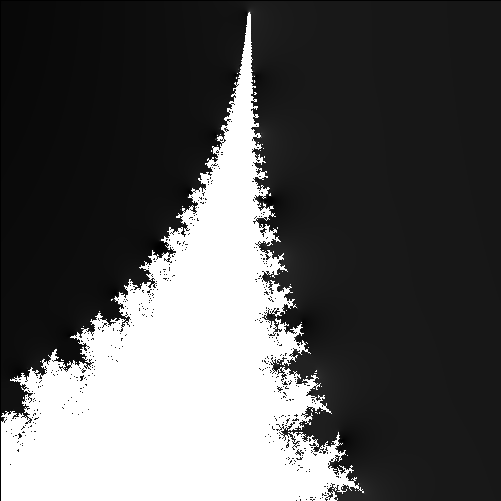
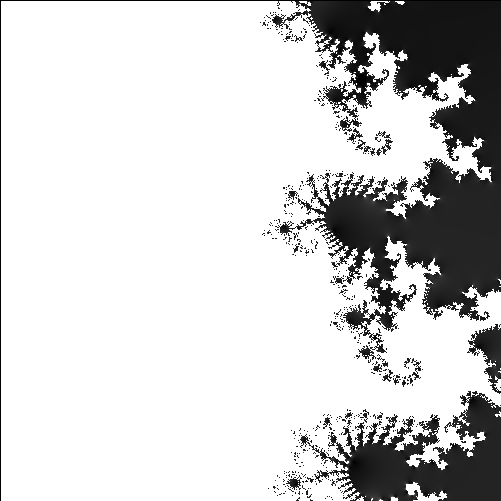
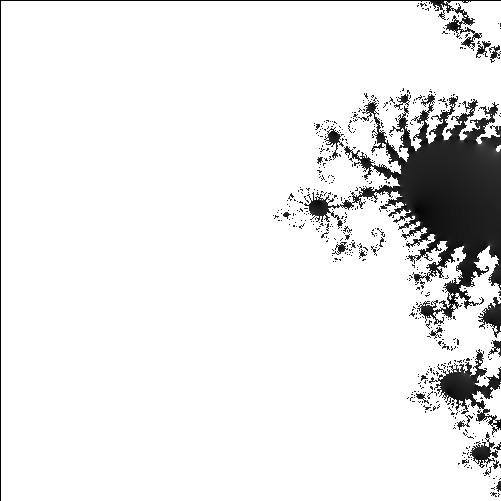
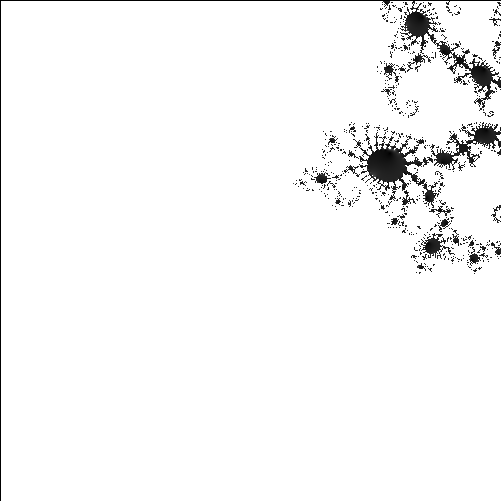
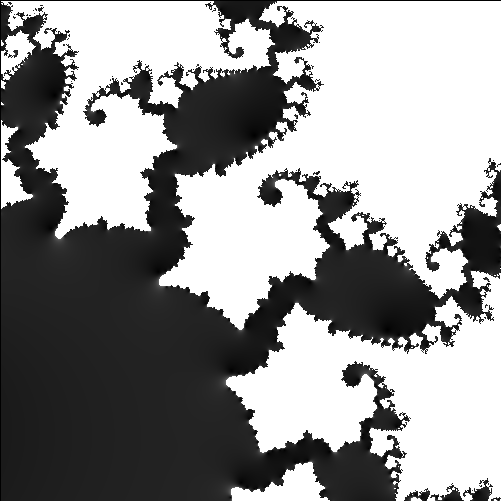
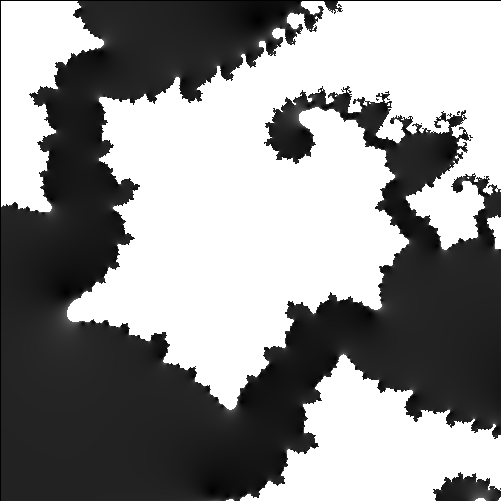
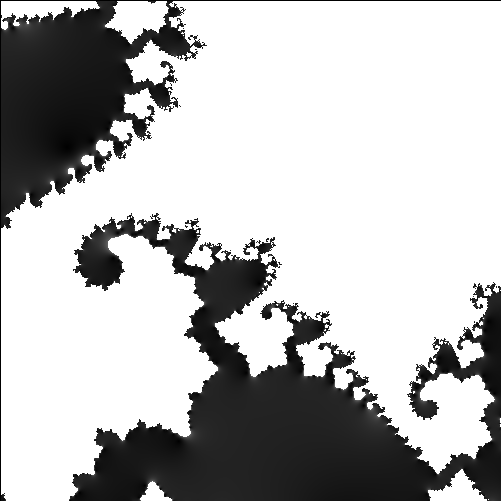
The closer you look at the border between what is in the set and what diverges, the more structure you find.
When creating these images it is convenient to use a simple x-y plane and assume a certain number of pixels in your image, say 400 by 400. You choose a center for your image somewhere in the plane, (x′, y′), somewhere less than 2 from the origin, and scale your pixels to represent numbers in the complex plane represented by c=(x-x′)/(scale)+i(y-y′)/(scale) and for each pixel start at z=0+0i and iterate until you reach above 2 or get tired of iterating. You then choose to color the pixel as being in the set or not (can even be just black or white) or shade according to the quickness of divergence or maximum value of z² reached for those you decide are in the set.
Note that you don't actually have to have the computer do complex math for you, since you are only finding one new (x,y) value from one old value each time and then testing whether or not x² + y² > 2. and new x value is just the old x value squared minus the old y value squared plus the pixel x value while each new y value is just 2 times the old x times the old y plus the pixel y. (It is kind of fun to work this out and show that it is that simple).

History
Benöit Mandelbrot published a paper in 1980 (after decades of work in complex analysis and complex dynamics) discussing the parameter space of quadratic polynomials. Adrien Douady and John H. Hubbard did detailed mathematical studies of the set establishing many of the fundamental properties and they are responsible for naming the set in honor of Mandelbrot. Popularization of the set came with the publications of images by Heinz-Otto Peitgen and Peter Richter. See "The Beauty of Fractals" 1986.
More Images


If you happen to have Matlab, you can right click here and choose to save the m-file and right click here to save the *.fig file that I wrote in Matlab to create images of the mandelbrot set. When downloading these files, the genius browsers will insist that they are .htm files so you will need to replace their suffix htm with m in the case of the m file and fig in the case of the fig file. I think that as long as these two files are in the same directory, you can direct matlab to that directory and run the command, "Mandelbrot" to use this simple application.
I also have a stand-alone application here that will install the application along with the Matlab MCR. Please right click and save the zipped executable named Mandelbrot_pkg.zip rather than running it over the net.... it is much easier that way. When you unzip or unpack the file you should have Mandelbrot_pkg.exe which will install on a windows computer. Have fun!
Quick Science & Math References
- Our Solar System.
- Earth Facts.
- The Metric System.
- Trigonometric Identities.
- Vector & Tensor Identities.
- Explicit Forms of Vector Operators
- Light & Electromagnetic Spectrum.
- Common Laser Wavelengths.
- Human Physiology Facts.
- Human History Timeline
- Geologic Timeline
- Cambrian Explosion
- Life on Earth Timeline
- ASCII Codes and HTML Display Codes
- Thousands of HTML Symbol Codes
- HTML Symbol Codes for Greek Letters
- The Best Way to put Equations on your Web Page
Physics Basics Series
- Basics of Classical Mechanics.
- Basics of Quantum Mechanics.
- Basics of Electrodynamics.
- Basics of Optics.
- Basics of Mathematical Tools for Physics.
- Basics of Plasma Physics.
- Basics of Solid State Physics.
Math Basics Series
- Numbers
- Arithmetic
- Algebra
- Geometry
- Analysis
Technology Basics Series
- Basics of Remote Sensing.
- Basics of Digital Signal Processing.
- Critical Electronic Circuits
- Infrared Imaging Basics
Knowledge Branches
- Information Theory
- How Reading Works in the Brain
- Psychology of Learning
- Logic
WORK IN PROGRESS
- What is the Stark Effect?
- The Chemistry of Love &/or Addiction
- Critical Thinking: How to question what you see, read or hear.
- Aristotle's Prior Analytics - the birth of Logic.
- Optical Solutions, lenses that solve problems
- Fractals
- PTC - Photon Transfer Curve or Mean Variance Analysis
- 3-D Noise
- Laser Primer
- Rail Guns
- Special Relativity
- Radar Technology
- Acousto-optic Cells
- Harmonic Generation for Laser Frequency Doubling (SHG) and Tripling -using non-linear crystals.
- Measurement: Accuracy & Precision.
- Things you should know about computer modeling of physical phenomena!
- Giant Magneto-resistance
- Peltier Cooling
- Pyro-Electric Detectors
- Piezo-Electric Crystals
- Laser Speckle
- FFT and DFT the fast fourier transform and the discrete fourier transform
- Fabry Perot Etalon
- The Hydrogen Atom.
- PCA (Principal Component Analysis)
- Energy per mass in fuels such as Hydrogen, Gasoline, Kerosene, HMX etc...
- Nobel prize winning work on the CCD
- How does a CCD work and what are the normal characteristics of a CCD
- Nobel Prize Winning work on Giant Magneto-resistance
- FROG -frequency resolved optical gating
- Optical Wavefront Sensing
- THz imaging and time-domain spectroscopy
- Camera Calibration
- Laser Designators
- Resampling